Building data quality checks in your pySpark data pipelines
Data quality is a rather critical part of any production data pipeline. In order to provide accurate SLA metrics and to ensure that the data is correct, it is important to have a way to validate the data and report the metrics for further analysis. In this post, we will look at how to build data quality checks in your pySpark data pipelines.
Exploring Delta Live Tables
Delta Live Tables is a new feature in Databricks that allows users to build reliable data pipelines with built-in data quality metrics and monitoring. It is a new abstraction on top of Delta Lake that allows users to query the data using streaming live tables. The data is updated in real-time as the underlying data changes. What caught my eye was the data quality capabilities that the users can specify on dataset level. Using python decorators we can specify @expect_all, @expect_all_or_drop, and @expect_all_or_fail expectations that accept a python dictionary as an argument, where the key is the expectation name and the value is the expectation constraint. Example:
@dlt.expect("valid timestamp", "col(“timestamp”) > '2012-01-01'")
@dlt.expect_or_drop("valid_current_page", "current_page_id IS NOT NULL AND current_page_title IS NOT NULL")
@dlt.expect_or_fail("valid_count", "count > 0")
Metrics of clean records and failed records are automatically collected and stored in the Delta Live Table metadata, so the users can set up alerts and monitor the data quality of their pipelines.
Delta Live Tables however still face quite some limitations and are not yet ready for production use. Some limitations include: 1. The data quality checks are only available for streaming live tables, not for batch tables. We can still create streaming tables from batch tables, but if the version of your data is changing the pipeline will fail. 2. Lack of testing capabilities. There is no way to test the data quality checks in a local environment because dlt package is available only in Databricks runtime. 3. Lack of documentation. The documentation is very limited and it is not clear how to use the data quality checks. Currently only python and SQL API are supported. 4. Setting up DLT job doesn't support all the parameters that are available in the Databricks job.
Building your own data quality checks as python decorators
In order to overcome the limitations of Delta Live Tables, we can build our own data quality checks as python decorators. The idea is to create a decorator that will accept a python list of arguments, which will be constraints that we will apply for a determined column. We will collect all the necessary metrics and store them as part of the Delta Lake metadata.
We will start by building two simple conditions for our data, uniqueness and filtering based on a condition.
from abc import ABC, abstractmethod

class ColumnCondition(ABC):
    @abstractmethod
    def get_cols(self):
        pass


class UniqueCondition(ColumnCondition):

    def __init__(self, col):
        self.col = col

    def get_cols(self):
        return self.col


class FilterCondition(ColumnCondition):

    def __init__(self, left_col, right_col):
        self.left_col = left_col
        self.right_col = right_col

    def get_cols(self):
        return self.left_col, self.right_col


def is_not_null(col):
    return FilterCondition(col + " is not null", col + " is null")

def is_unique(col):
    return UniqueCondition(col)
The main idea is to use a function as a decorator argument using a certain column, which will return a condition object. We can use the condition object to pattern match and apply the specific function depending on the condition type. We start by creating a simple python decorator using functools wraps:
    def expect_or_drop(self, conditions: List[FilterCondition]):
        def decorator(function):
            @wraps(function)
            def wrapper(*args, **kwargs):
                retval = function(*args, **kwargs)
                # apply conditions
                return retval
            return wrapper
        return decorator
We will create an Expectations class that will contain all the data quality checks. The rsd arguments represents the maximum relative standard deviation allowed for the approx_count_distinct_functions. Read more here.
class Expectations:

    def __init__(self, spark: SparkSession, rsd=0.05):
        self.spark = spark
        self.schema = StructType([StructField("condition", StringType(), True),
                                  StructField("dropped_records", IntegerType(), True),
                                  StructField("clean_records", IntegerType(), True)])
        emptyRDD = spark.sparkContext.emptyRDD()
        self.metrics = spark.createDataFrame(emptyRDD, schema=self.schema)
        self.rsd = rsd
The metrics dataframe will contain the metrics for each data quality check. We can proceed to create our filtering and uniqueness checks:
    def apply_condition(self, dataframe, condition):
        if isinstance(condition, FilterCondition):
            return self.filter_condition(dataframe, condition.get_cols())
        elif isinstance(condition, UniqueCondition):
            return self.is_unique_extend(dataframe, condition.get_cols())
        return dataframe

    def filter_condition(self, dataframe: DataFrame, left_right) -> DataFrame:
        left, right = left_right
        total_records = dataframe.count()
        dropped_records = dataframe.filter(right).count()
        df = self.spark.createDataFrame([(left, dropped_records, (total_records - dropped_records))], schema=self.schema)
        self.metrics = self.metrics.unionAll(df)
        return dataframe.filter(left)

    def is_unique_extend(self, dataframe: DataFrame, col) -> DataFrame:
        total_records = dataframe.select(F.col(col)).count()
        distinct_records = dataframe.select(F.approx_count_distinct(col, self.rsd)).collect()[0][0]
        dropped_records = total_records - distinct_records
        df = self.spark.createDataFrame([(col + " is unique", dropped_records, distinct_records)], schema=self.schema)
        self.metrics = self.metrics.unionAll(df)
        return dataframe.dropDuplicates([col])
In order to apply the conditions we will use the apply_condition function to every condition in the list. In order to do that we will use the functools reduce function as foldLeft:
   foldl = lambda func, acc, xs: reduce(func, xs, acc)
   @wraps(function)
   def wrapper(*args, **kwargs):
        retval = function(*args, **kwargs)
        return foldl(self.apply_condition, retval, conditions)
Wrapping it all together:
from abc import ABC, abstractmethod
from functools import reduce, wraps
from typing import List

import pyspark.sql.functions as F
from pyspark.sql import DataFrame, SparkSession
from pyspark.sql.types import IntegerType, StringType, StructField, StructType

foldl = lambda func, acc, xs: reduce(func, xs, acc)


class ColumnCondition(ABC):
    @abstractmethod
    def get_cols(self):
        pass


class UniqueCondition(ColumnCondition):

    def __init__(self, col):
        self.col = col

    def get_cols(self):
        return self.col


class FilterCondition(ColumnCondition):

    def __init__(self, left_col, right_col):
        self.left_col = left_col
        self.right_col = right_col

    def get_cols(self):
        return self.left_col, self.right_col


def is_not_null(col):
    return FilterCondition(col + " is not null", col + " is null")


def is_unique(col):
    return UniqueCondition(col)


class Expectations:

    def __init__(self, spark: SparkSession, rsd=0.05):
        self.spark = spark
        self.schema = StructType([StructField("condition", StringType(), True),
                                  StructField("dropped_records", IntegerType(), True),
                                  StructField("clean_records", IntegerType(), True)])
        emptyRDD = spark.sparkContext.emptyRDD()
        self.metrics = spark.createDataFrame(emptyRDD, schema=self.schema)
        self.rsd = rsd

    def expect_or_drop(self, conditions: List[FilterCondition]):
        def decorator(function):
            @wraps(function)
            def wrapper(*args, **kwargs):
                retval = function(*args, **kwargs)
                return foldl(self.apply_condition, retval, conditions)
            return wrapper
        return decorator

    def apply_condition(self, dataframe, condition):
        if isinstance(condition, FilterCondition):
            return self.filter_condition(dataframe, condition.get_cols())
        elif isinstance(condition, UniqueCondition):
            return self.is_unique_extend(dataframe, condition.get_cols())
        return dataframe

    def filter_condition(self, dataframe: DataFrame, left_right) -> DataFrame:
        left, right = left_right
        total_records = dataframe.count()
        dropped_records = dataframe.filter(right).count()
        df = self.spark.createDataFrame([(left, dropped_records, (total_records - dropped_records))], schema=self.schema)
        self.metrics = self.metrics.unionAll(df)
        return dataframe.filter(left)

    def is_unique_extend(self, dataframe: DataFrame, col) -> DataFrame:
        total_records = dataframe.select(F.col(col)).count()
        distinct_records = dataframe.select(F.approx_count_distinct(col, self.rsd)).collect()[0][0]
        dropped_records = total_records - distinct_records
        df = self.spark.createDataFrame([(col + " is unique", dropped_records, distinct_records)], schema=self.schema)
        self.metrics = self.metrics.unionAll(df)
        return dataframe.dropDuplicates([col])
We can proceed with writing a simple test to check the results and a metrics with a simple input dataframe:
def test_multiple_conditions(spark):
    df_1 = spark.createDataFrame([("row1", 1), ("row1", 2), (None, 3)], ["row", "row_number"])
    expectation = Expectations(spark)

    @expectation.expect_or_drop([is_not_null("row"), is_unique("row")])
    def read_dataframe(df):
        return df

    result = read_dataframe(df_1)
    print(result.collect())
    print(expectation.metrics.collect())
The console will print:
[Row(row='row1', row_number=1)]
[Row(condition='row is not null', dropped_records=1, clean_records=2), Row(condition='row is unique',
dropped_records=1, clean_records=1)]
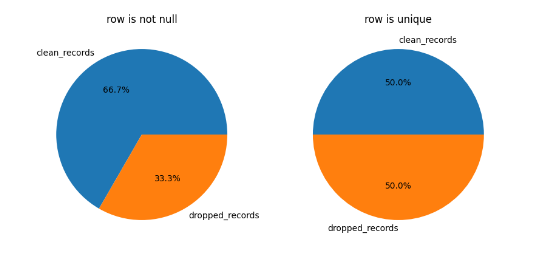
We can extend and add some plotting functions as well to our Expectations class.
    def plot_pie_with_total(self, figsize=(10, 10)):
        labels = ["clean_records", "dropped_records"]
        df = self.metrics.toPandas()
        size = len(df.index)
        if size == 1:
            fig, axs = plt.subplots(1)
            axs.pie(df.iloc[0][labels], labels=labels, autopct='%1.1f%%')
            axs.set_title(df.iloc[0]["condition"])
        else:
            fig, axs = plt.subplots(1, size, figsize=figsize)
            for i in range(size):
                axs[i].pie(df.iloc[i][labels], labels=labels, autopct='%1.1f%%')
                axs[i].set_title(df.iloc[i]["condition"])
        plt.show()
That will generate a pie chart with the metrics for every condition:
Happy coding and stay safe!